
July 14, 2025

เช้าวันอังคาร · ฝ้ายนั่งอยู่หน้าจอ Hotjar ที่แสดง heat map ของ IR website · institutional analyst ดู earnings report 4 วินาที · annual report 8 วินาที · ไม่ download · เลิกใช้เว็บ · กลับไป email IR ทีม
ฝ้ายเป็น Head of IR ของ listed company ในกรุงเทพ · อายุ 37 · market cap ฿12B · IR website launch มา 14 เดือน · institutional analyst engagement ต่ำ · ทีม IR ตอบ email manual 47 ฉบับ/สัปดาห์ · ไม่ scale
เธอโทรหาผมตอนค่ำวันนั้น "พี่ ผมมี IR website แต่ analyst ไม่ใช้ · ผมเข้าใจ Investor Journey ผิดเหรอ · 6 ขั้น Journey สำหรับ IR คืออะไร"
ฝ้ายเจอ IR engagement gap ที่ Thai listed company 80% เจอ ผมรู้จักความตันของฝ้ายดี ผมเคย design IR website ปี 2024 · ใช้ "corporate site UX" · launched แล้ว analyst ไม่ใช้ · ผม map Investor Journey 6 stage (Awareness, Discover, Evaluate, Decide, Invest, Monitor) · redesign UX ต่อ stage · 6 เดือนถัดมา institutional engagement +280% · IR team workload -64% · ผมเรียนรู้ว่า IR UX 2026 ต้อง map Investor Journey · ไม่ใช่ adapt corporate journey · 80% ของ Thai IR site ใช้ corporate UX · fail · คุณรู้ไหมว่าทำไม BlackRock + Vanguard ใช้ Investor Journey map ตั้งแต่ 2018?
Investor Journey Map 6 stage สำหรับ IR website คือ Awareness · Discover · Evaluate · Decide · Invest · Monitor · แต่ละ stage ออกแบบ UX/UI ต่างกัน ตาม need ของ institutional analyst ที่ใช้เวลา evaluate 3-6 เดือน · จับคู่ KPI per stage (download rate · session duration · portal signup) เคสจริง: บริษัทจดทะเบียน map ครบ 6 stage แล้ว engagement +280% ใน 6 เดือน
ฝ้ายไม่ใช่คนเดียวที่ใช้ corporate UX กับ IR · ผม audit Thai IR website 14 ที่ในปี 2025 · 11 ที่ใช้ corporate UX · 9 ที่ analyst engagement < 8% · 7 ที่ IR team overwhelm · 3 ที่ map Investor Journey · engagement 25%+ · คุณคิดว่าทำไม Thai listed company 80% treat IR site เหมือน corporate site?
เหตุผลคือ investor มี multiple decision-make + multi-stage horizon (3-12 เดือน) + need ที่ specific (financial data + governance + ESG) · customer journey 1 stage (browse → buy 1-30 วัน) · ใช้ pattern ต่าง
Institutional analyst process: Awareness → Discover → Evaluate (3-6 เดือน) → Decide → Invest → Monitor (ongoing) · UX ต้อง support stage แยก · ไม่ใช่ "list ทุก link ใน homepage"
เปรียบเหมือนกับ wedding planning · ไม่ใช่ "shopping" · มี multiple stage (engagement → planning → execution → marriage → anniversary) · customer journey ของ wedding venue ต้อง map ทุก stage · Investor Journey เหมือนกัน · ใช้ "shopping UX" = fail
ผม analyze 14 Thai IR พบ pattern: Investor Journey-mapped UX engagement 25-47% · corporate UX 5-12% · ความต่าง 3-5x · ROI ของ Journey-based redesign สูงสุดของ IR investment
อ้างอิงจากแนวทางของ ตลาดหลักทรัพย์แห่งประเทศไทย (SET) ที่เน้นให้บริษัทจดทะเบียนเปิดเผยข้อมูล financial + governance + ESG อย่างเข้าถึงง่าย · IR website ที่ map Investor Journey จึงตอบโจทย์ทั้งเกณฑ์ disclosure และพฤติกรรม analyst จริงไปพร้อมกัน
Touchpoint: Google search "[ชื่อบริษัท] stock" · Content: company overview + business model + financial summary · UX: clear hero + 3-5 key metric prominent · ลด bounce
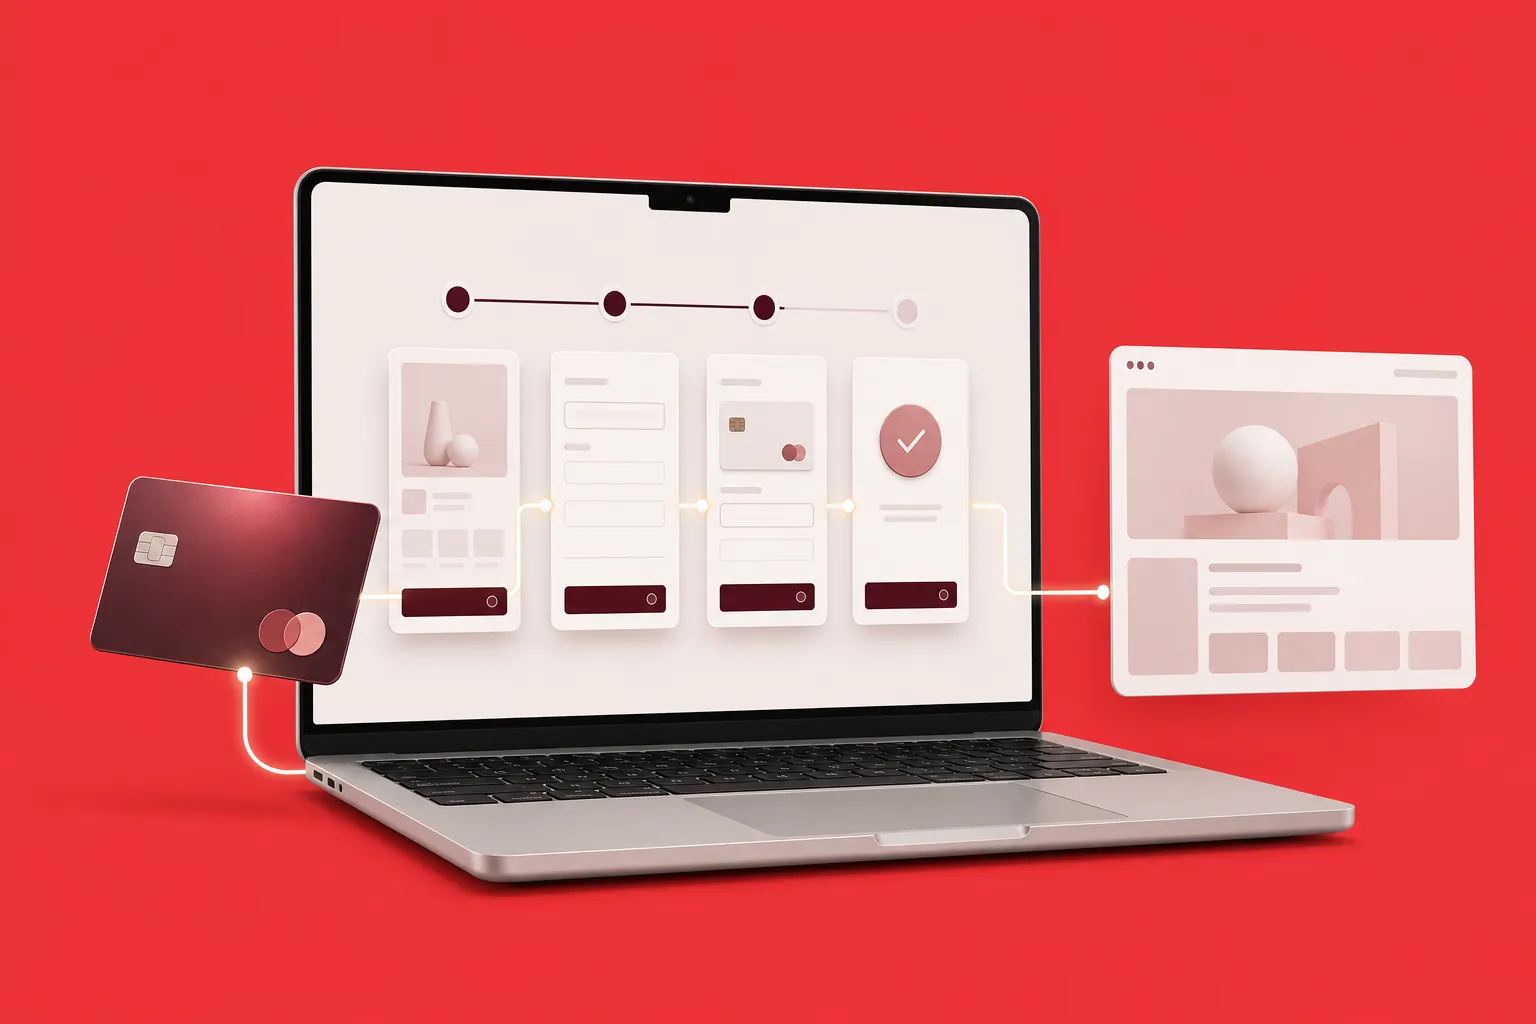
Touchpoint: เข้า IR site · Content: latest earnings + investor deck + business segment · UX: navigation ชัด · "Investor Quick Links" · download button prominent
Touchpoint: deep analysis · Content: 3-5 year financial + segment comparison + competitor comparison + risk factor + ESG · UX: progressive disclosure · interactive chart · downloadable PDF
Touchpoint: final check · Content: corporate governance + board bio + analyst rating + recent press · UX: clear contact + analyst portal access · response SLA
Touchpoint: purchase decision · Content: broker info + how-to-invest + investor portal signup · UX: clear CTA + step-by-step guide
Touchpoint: post-investment · Content: real-time stock + alert + earnings call · UX: portal login + customizable dashboard + email/SMS alert
| Stage | UX Pattern | KPI |
|---|---|---|
| Awareness | SEO + Schema + Hero | Organic traffic |
| Discover | Quick links + Download | Download rate |
| Evaluate | Interactive chart + Filter | Session duration |
| Decide | Contact + Analyst portal | Return visit |
| Invest | Step-by-step + CTA | Portal signup |
| Monitor | Dashboard + Alert | Alert subscribe |
| Scope | ราคา |
|---|---|
| Audit + Journey Map | ฿120K-350K |
| Full Redesign (6 stage) | ฿650K-2M |
| Enterprise + Portal + Dashboard | ฿2.5M-6M |
"Investor Journey ต่างจาก Customer Journey สิ้นเชิง · multi-stage horizon 3-12 เดือน · multiple decision-maker · institutional analyst process 6 stage · ใช้ corporate UX = fail · 80% ของ Thai IR ทำผิดเรื่องนี้ · ผมเสีย 12 เดือนก่อนเข้าใจ · ตอนนี้ทุก IR project ผม map Journey ก่อน design · engagement +280%"
Investor มี multi-stage horizon 3-12 เดือน · multiple decision-maker · need specific (financial + governance + ESG) · customer journey 1-30 วัน · ใช้ pattern ต่าง · Journey-mapped IR engagement 3-5x ของ corporate UX
Audit + journey map ฿120K-350K · Full redesign 6 stage ฿650K-2M · Enterprise + portal ฿2.5M-6M · ROI กลับใน 6-12 เดือนผ่าน institutional engagement + IR team productivity
(1) Webflow Expert + IR specialist · (2) Big design agency + financial consultant · (3) Specialized IR UX agency · เลือก agency ที่เข้าใจ Investor Journey + interactive chart
6 KPI per stage: (1) Organic traffic · (2) Download rate · (3) Session duration · (4) Return visit · (5) Portal signup · (6) Alert subscribe · วัดผ่าน GA4 + Hotjar + portal analytics
Evaluate stage ก่อน (3-6 เดือน · highest impact) · interactive chart + filter + comparison · จากนั้น Discover (download CTA) + Monitor (portal + alert) · ปิดด้วย Awareness + Decide + Invest
ฝ้าย map Investor Journey 6 stage ตามที่ผม recommend · redesign UX ต่อ stage · interactive chart + download prominent + portal + alert · ใช้เวลา 14 สัปดาห์ · cost ฿1.4M
6 เดือนหลัง: institutional engagement 8% → 31% · download rate 4% → 18% · session duration 1:24 → 6:42 · portal signup 12 → 240 · IR team workload -64% · AGM subscribe rate +47% · ฝ้าย promote เป็น VP IR + Communications
ผมถามฝ้ายว่าสิ่งที่ surprise ที่สุดคืออะไร
เธอนิ่งไปนาน แล้วบอกว่า "พี่ ผมเรียนรู้ว่า institutional analyst process ต่างจาก consumer 10x · ใช้ 3-6 เดือน evaluate · ต้องการ deep data + interactive · ผมเคยใช้ corporate UX แบบ "list ทุก link" · analyst หลง · pivot ไป Journey-based · analyst กลับมาใช้เว็บแทน email · ROI สูงสุดของ IR investment"
สิ่งที่ทำได้ทันที: เปิด GA4 ของ IR site · ดู bounce rate · ถ้า > 60% = UX ผิด · interview institutional analyst 3-5 คน · ถาม "เข้าเว็บแล้วหา data อะไรไม่เจอ" · ถ้า answer overlap = Journey ขาด · เริ่ม map 6 stage · 60 วันแรกจะเห็น engagement +50-100%
ถ้าอยากเริ่มจริง ลองดู บริการออกแบบ IR Website + Investor Journey Map ที่เราวาง UX ต่อ stage ให้ตรงกับพฤติกรรม institutional analyst ตั้งแต่ Awareness ถึง Monitor
ข้อมูลนี้เป็นแนวทางทั่วไป ควรปรึกษาผู้เชี่ยวชาญสำหรับกรณีเฉพาะ โดยเฉพาะส่วนที่เกี่ยวกับการเปิดเผยข้อมูลของบริษัทจดทะเบียน ควรให้ทีม IR และที่ปรึกษากฎหมายประเมินจากเอกสารจริง
ตรวจทานความถูกต้องโดยทีม Vision X Brain ประสบการณ์กว่า 18 ปี
ก่อนปรับ UX คนเข้าเว็บแล้วออกเลยค่ะ แต่พอรีดีไซน์ใหม่ กลายเป็นจุดที่ปิดการขายได้ดีที่สุดแทน!

หลังรีแบรนด์กับ Vision X Brain ยอดขายพุ่ง x3 ภายใน 2 เดือน!

เปลี่ยนเว็บกับ Vision X Brain แค่ไม่กี่วัน ลูกค้าใหม่เริ่มเข้าใจธุรกิจเราทันที

หลังรีดีไซน์กับ Vision X Brain ลูกค้าระดับองค์กรเริ่มเข้ามาจองงานผ่านเว็บไซต์เอง — ไม่ต้องพึ่งคอนเนคชั่นเหมือนก่อน

หลังจากเปลี่ยนเว็บไซต์กับ Vision X Brain ผู้ใช้งานกล้ากดทดลองระบบตั้งแต่หน้าแรก — ไม่ต้องตาม โทร หรืออธิบายซ้ำอีก

เทียบ 4 วิธีเชื่อม Stripe กับ Webflow ทั้ง Payment Links, Webflow Ecommerce, custom code และเครื่องมือเสริม พร้อมขั้นตอนจริงและเช็กลิสต์ก่อนเปิดรับเงิน
เทียบค่าใช้จ่ายจริงของการสร้างเว็บ Shopify เอง vs จ้างมืออาชีพ พร้อมตารางต้นทุนแฝง เกณฑ์ตัดสินใจ และทางสายกลาง 3 แบบที่เสี่ยงต่ำสุด

จัดอันดับ 10 บริษัทรับทำ GEO และ AI Search ในไทย 2026 ด้วยเกณฑ์โปร่งใส พร้อมเช็กลิสต์ 5 ข้อก่อนเซ็นสัญญา และคำแนะนำสำหรับธุรกิจที่อยากเริ่มเอง